From Chaos to Clarity: The Story Behind the Gantt Chart


How Henry Laurence Gantt transformed scheduling from factory-floor confusion into the foundation of modern project management.
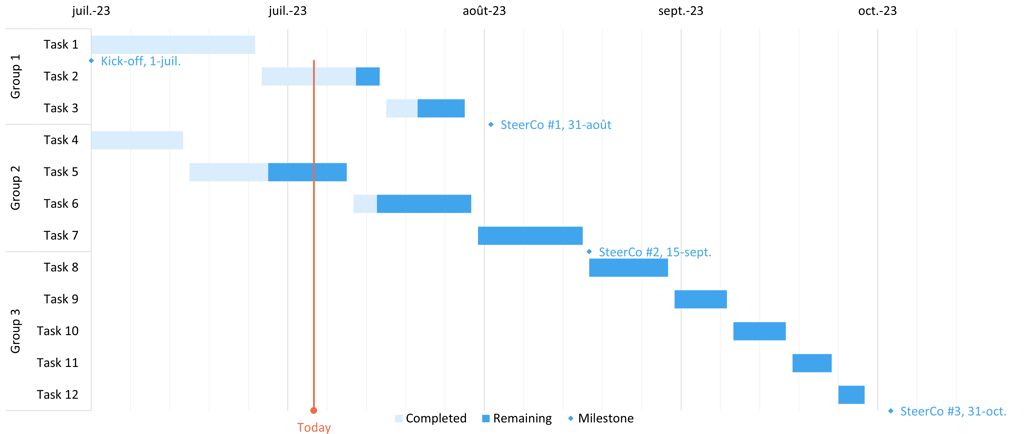
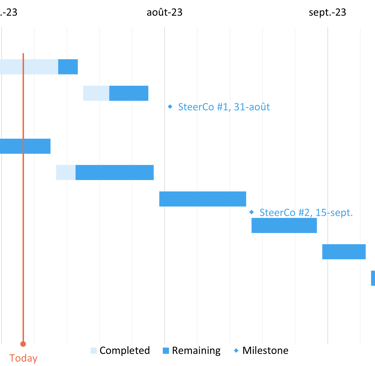
Long before digital dashboards and cloud-based project tools existed, Henry Gantt introduced a simple yet revolutionary idea: visualize time. What began as horizontal bars on paper evolved into a global standard used in megaprojects like the Hoover Dam and the Interstate Highway System.
Ever wondered why we all suddenly become "project managers" every time we open Google Calendar or look at a shift schedule? We all know what scheduling is—basically, it’s just organizing who does what and when. But there is one tool so iconic that even people who don't know how to use it have definitely seen it: the Gantt Chart.
You’ve probably seen those long, colorful horizontal bars in Excel or project management apps. But do you know the person behind that famous graph?
A. Henry Gantt: The Pioneer
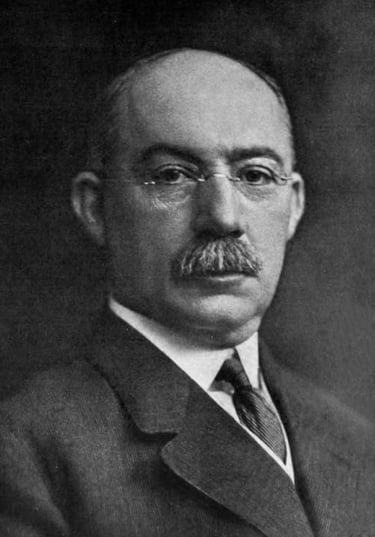
Many people think "Gantt" is an acronym, but it’s actually the last name of Henry Laurence Gantt (1861–1919). He was an American mechanical engineer who actually had a very noble goal.
In the early 1900s, factory floors were chaotic. Laborers worked without clear direction, and managers were often confused about why production was lagging. Henry Gantt hated that inefficiency.
Why did he invent the Gantt Chart?
Henry didn’t just want jobs finished fast; he wanted them measurable. He created this chart to
● Empower Workers: He wanted workers to know exactly what was expected of them and see their own progress.
● Bonuses and Motivation: Gantt was one of the first to propose a bonus system. If a worker finished a task faster than the schedule on the chart, they got extra pay.
● Visualizing Time: Before him, people just wrote long lists. Gantt turned "lists" into "pictures" so the human eye could immediately spot where things overlapped or clashed.
The Gantt Chart’s popularity exploded when it was used to manage massive projects like the Hoover Dam and the U.S. Interstate Highway System. Since then, the world of work has never been the same.
B. The Evolution: From Simple Bars to Complex Networks
As time went on, people realized life wasn't as simple as Henry’s boxes. Henry showed when something was done, but he didn't necessarily show what happens if one task is late.
● Relationships (Dependencies)
After Henry’s era, experts started adding arrows. If you haven't bought the cement, you can't build the wall. This is called a Relationship. The schedule stopped being just a calendar and became a web of interconnected events.
● The Critical Path Method (CPM)
In the 1950s, the term Critical Path emerged. The Critical Path is the sequence of "must-do" tasks that cannot slip by even a second. If the activity takes too long, the whole date is delayed.
● Digitalization and the Cloud
Today, we don’t draw on tracing paper like Henry did. We have software that automatically recalculates everything. If one task moves back by a day, a thousand tasks behind it shift instantly.
Why does this matter?
In your world—especially in roles like Planning and Control—Henry Gantt’s principles are still the "oxygen" of the daily grind. Whether you're using an online dashboard or dreaming up future robotics, the foundation remains: Visualizing time is the key to efficiency.
Henry Gantt proved that by simply drawing lines on a piece of paper, we could build giant dams, win wars, and even send humans to the moon.
It’s fascinating how a simple chart changed how the world works, isn't it?
For more on schedule digitalization, we have our very own application called INPORMASI. Please feel free to contact our marketing for a free demo.
Let Get Started!
Take the first step toward your project's success with just contact with us.
Phone
+62 812-1699-5252
gatot.prasetyo@sasinfinity.com
Contact Us!
Address
Jl. Kramat Pulo Dalam I No.98E, Senen, Jakarta Pusat
Contacts
+62 812-1699-5252
gatot.prasetyo@sasinfinity.com